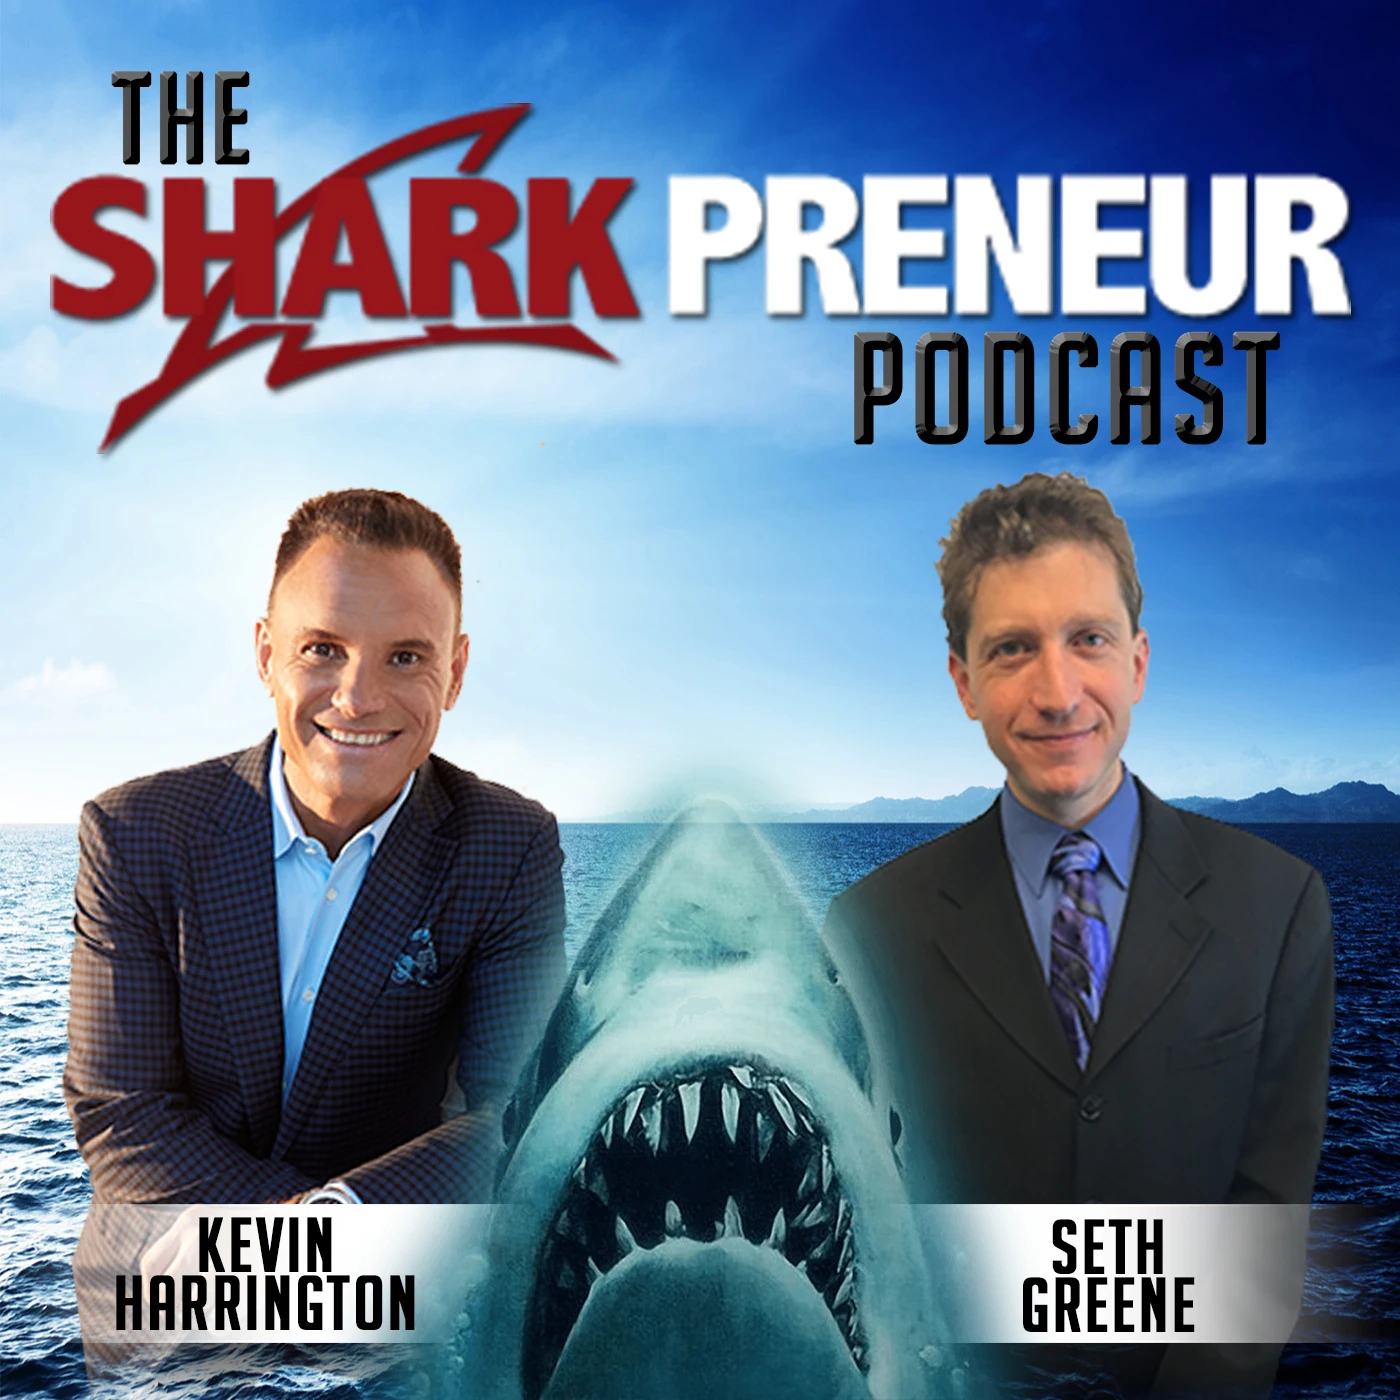
Seth Greene
Financial Independence Association Algorithm

Seth Greene
•5-26-2023
DESCRIPTION
https://www.financialindependenceassociation.com/intro
Attention aggressive investors. How would you like to know the secret formula that reveals the top 2% of 8,737 traded stocks in the United States, a proprietary process that identifies which two companies to own each month, and the proven method that shows you when to buy and sell each month?
Announcing the Financial Independence Association trading algorithms.
During the pandemic 2019 - 2022, the S&P 500 generated an average annual rate of return of 9% with a total return of 29.8%, turning a $10,000 investment into $12,979. Not too shabby.
Our two stock per month trading algorithm generated an annual return of 29.7%. A total return of 118.3% turned $10,000 into 21,286, almost double the S&P 500.
Our one stock per week algorithm generated an annual return of 81%, a total return of 506%, and turned that $10,000 into 60,680. Almost five times the S&P 500. But wait, there is more.
Our two stocks per week trading algorithm generated an annual return of 311.5%, a total return of 8298% in the same time that the S&P did 29.8% and turned $10,000, buckle your seatbelt, into $902,846.
Sound too good to be true? Register now. Click the link, fill out the form to watch the rest of this video to find how you can put the power of these algorithms to work for you today, before they make us take down the video.
https://www.financialindependenceassociation.com/intro
In Queue
UP NEXT

EP 463: Recruiting Trends in the Financial Services IndustryDavid and Jeff Testerman, Brokerhunter
9-21-2020

1012: Maximizing Success in Consumer Products
1-15-2024

474: Scaling Systems – How to Grow Your Business Without Going Crazy
10-12-2020

Get Your Copy of Don Turnbull's New Book
11-8-2017